| Name |
Left bundle branch block (LBBB) |
| Category |
Cardiovascular |
| Sex |
|
| Adult |
Yes |
| UUID |
71200a70-ddbf-4094-ac6d-6dc91623b984 |
| Definition |
Left bundle branch block (LBBB) is a cardiac conduction abnormality. |
Ontologies
Key Summary Statistics
Cases from any source
| Total |
5353 |
| Female (%) |
2249 (42%) |
| Male (%) |
3104 (58%) |
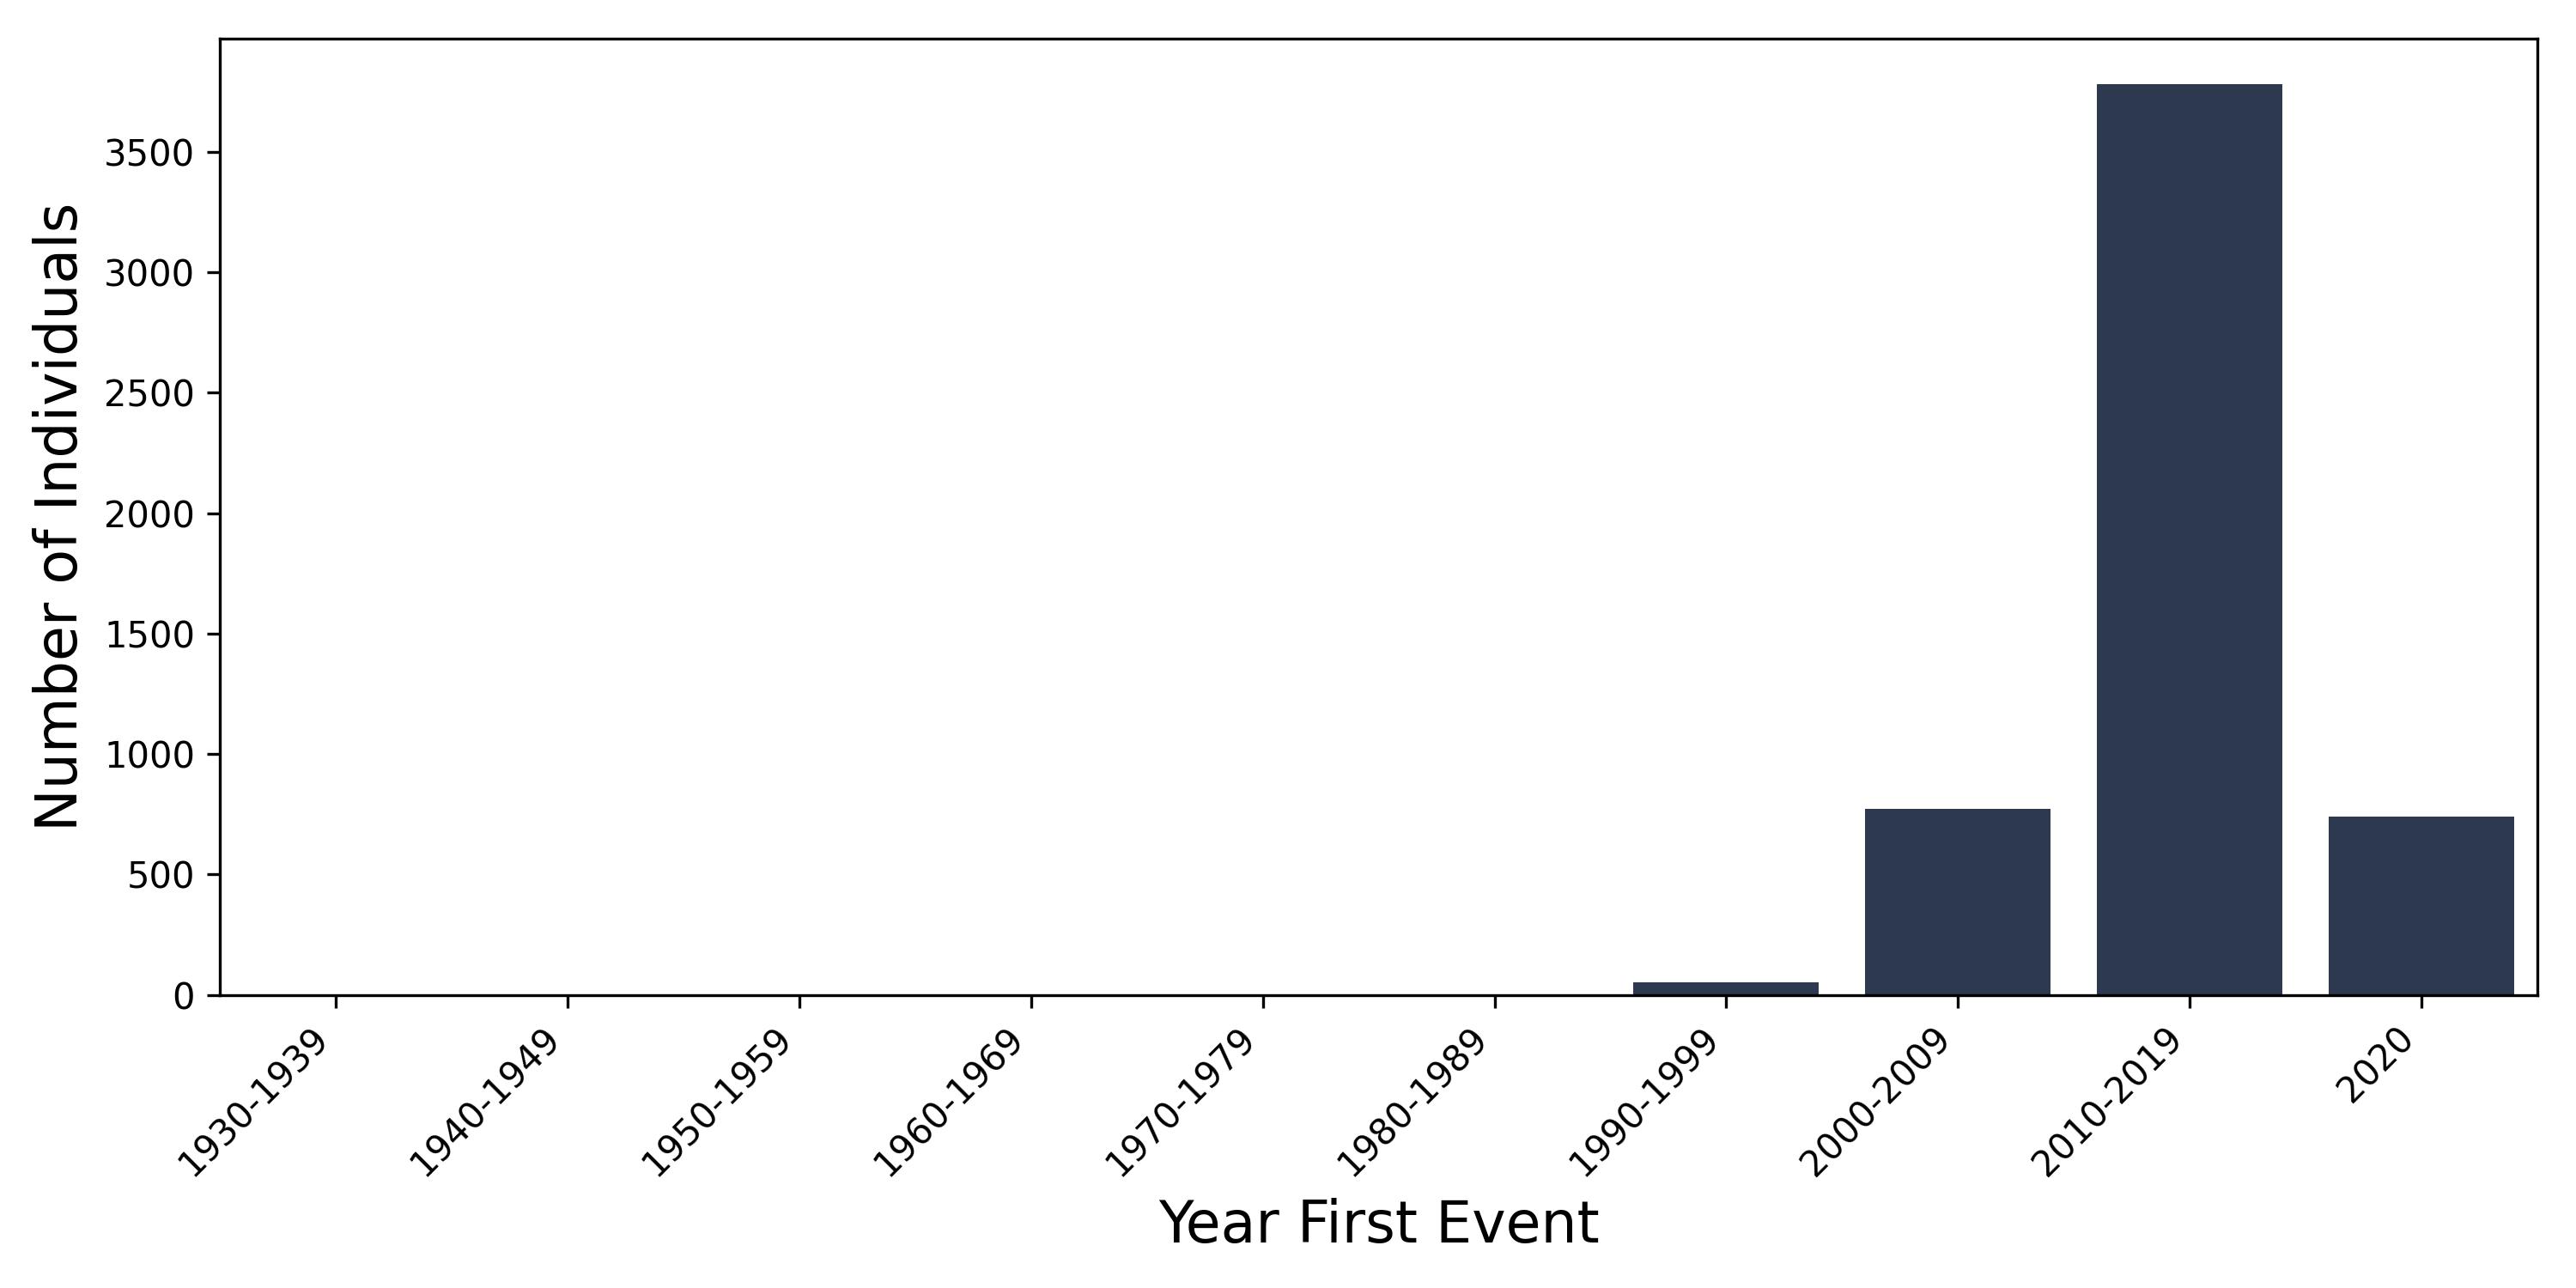
Year first recorded
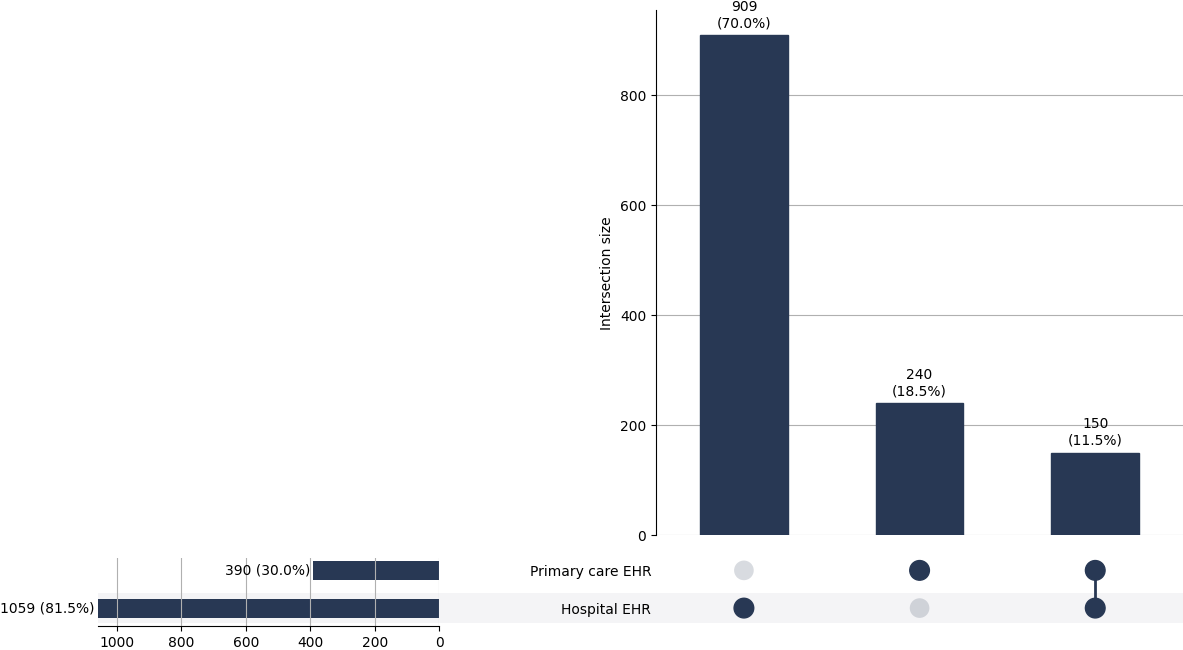
Cases linked in all UK Biobank sources
Cross-source concordance
Vertical bars correspond to number of cases per source/intersection; horizontal bars to left correspond to total number of cases per source.
Incidence & prevalence
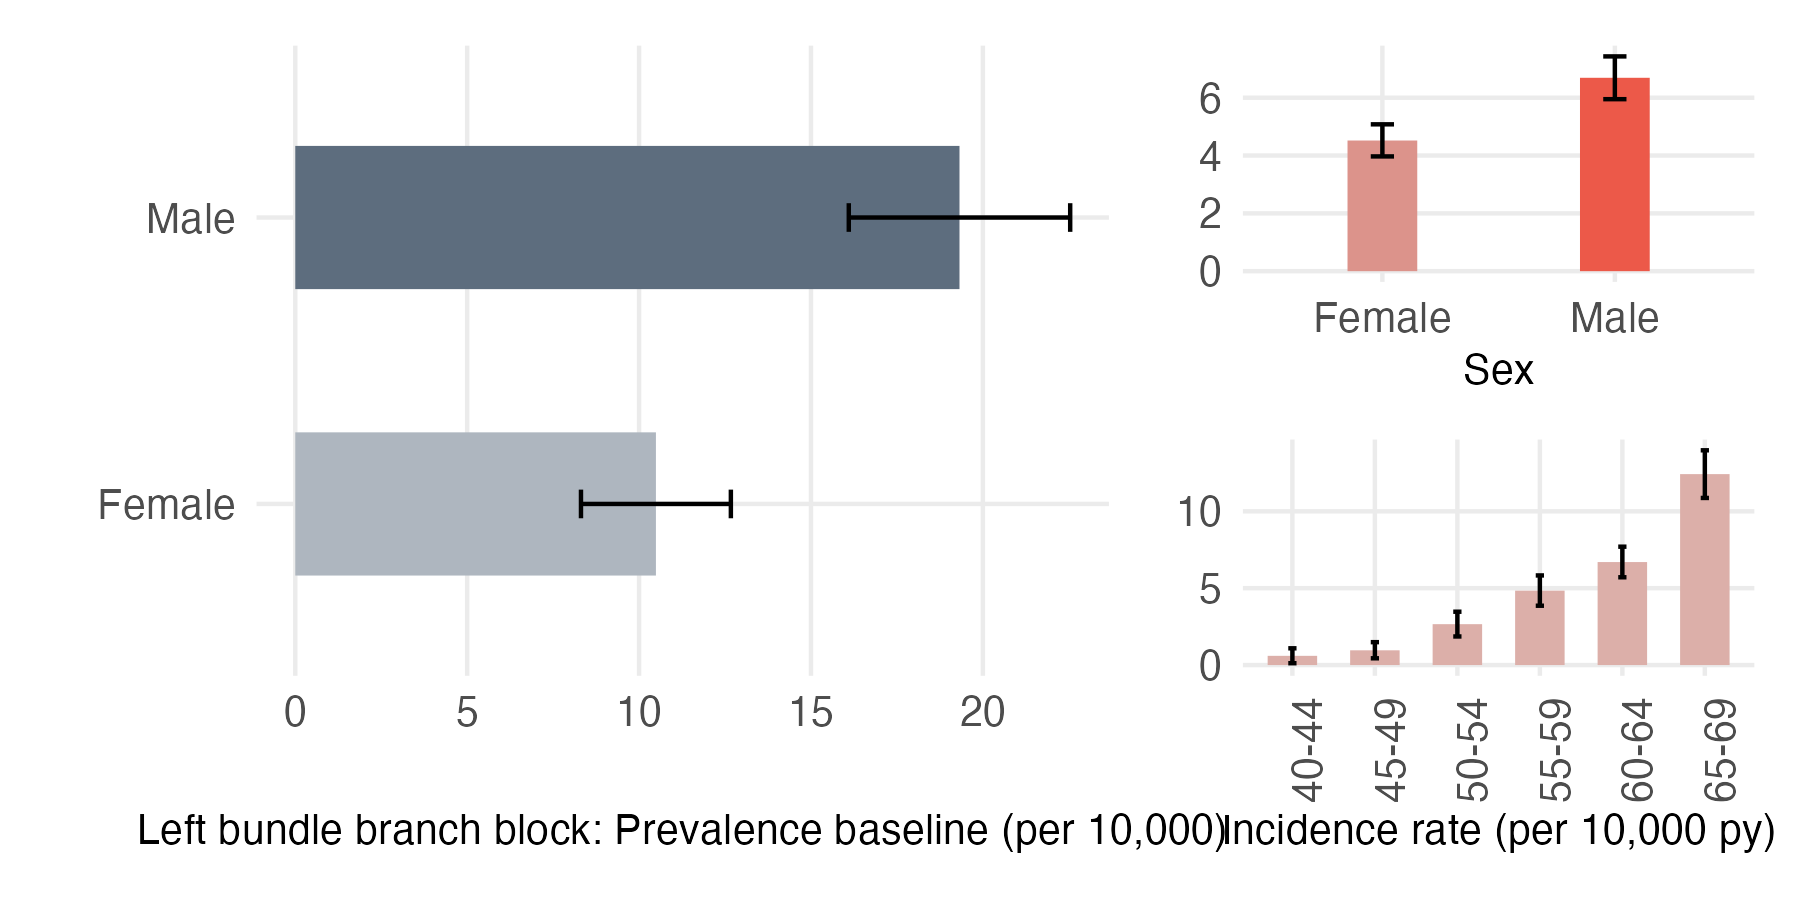
Baseline prevalence stratified by sex
| Female |
10.49 (8.31,12.67) |
| Male |
19.32 (16.1,22.54) |
Incidence stratified by sex
| Female |
4.52 (3.97,5.08) |
| Male |
6.69 (5.95,7.43) |
Incidence stratified by age
| Ages 40-44 |
0.6 (0.12,1.09) |
| Ages 45-49 |
0.96 (0.44,1.49) |
| Ages 50-54 |
2.66 (1.86,3.47) |
| Ages 55-59 |
4.84 (3.86,5.83) |
| Ages 60-64 |
6.7 (5.71,7.7) |
| Ages 65-69 |
12.42 (10.87,13.97) |
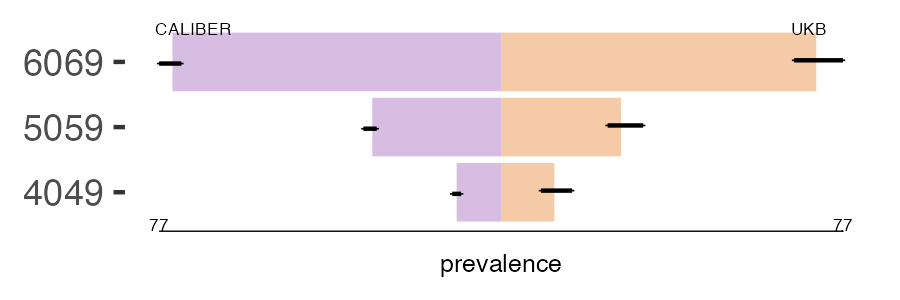
Period prevalence
Methods
Comparison with general population
Sex-standardised prevalence from CALIBER study (Kuan et al. 2019)
| Population |
Ages 40-49 |
Ages 50-59 |
Ages 60-69 |
| UK Biobank |
12 (9,16) |
27 (24,32) |
71 (66,77) |
| CALIBER |
10 (9,11) |
29 (28,31) |
74 (72,77) |
Stratified by age and Townsend deprivation status
| Deprivation status |
Ages 40-49 |
Ages 50-59 |
Ages 60-69 |
| Least deprived |
13(6,25) |
28(20,39) |
57(47,69) |
| Low |
9(3,19) |
25(17,36) |
66(55,79) |
| Medium |
3(0,10) |
29(21,40) |
79(67,93) |
| High |
17(9,28) |
28(20,39) |
66(54,80) |
| Most deprived |
18(11,28) |
26(18,36) |
92(78,109) |
Stratified by age and country
| Country |
Ages 40-49 |
Ages 50-59 |
Ages 60-69 |
| England |
12(8,16) |
28(24,33) |
72(66,79) |
| Scotland |
10(3,24) |
24(15,37) |
67(52,84) |
| Wales |
23(9,48) |
25(13,43) |
68(50,90) |
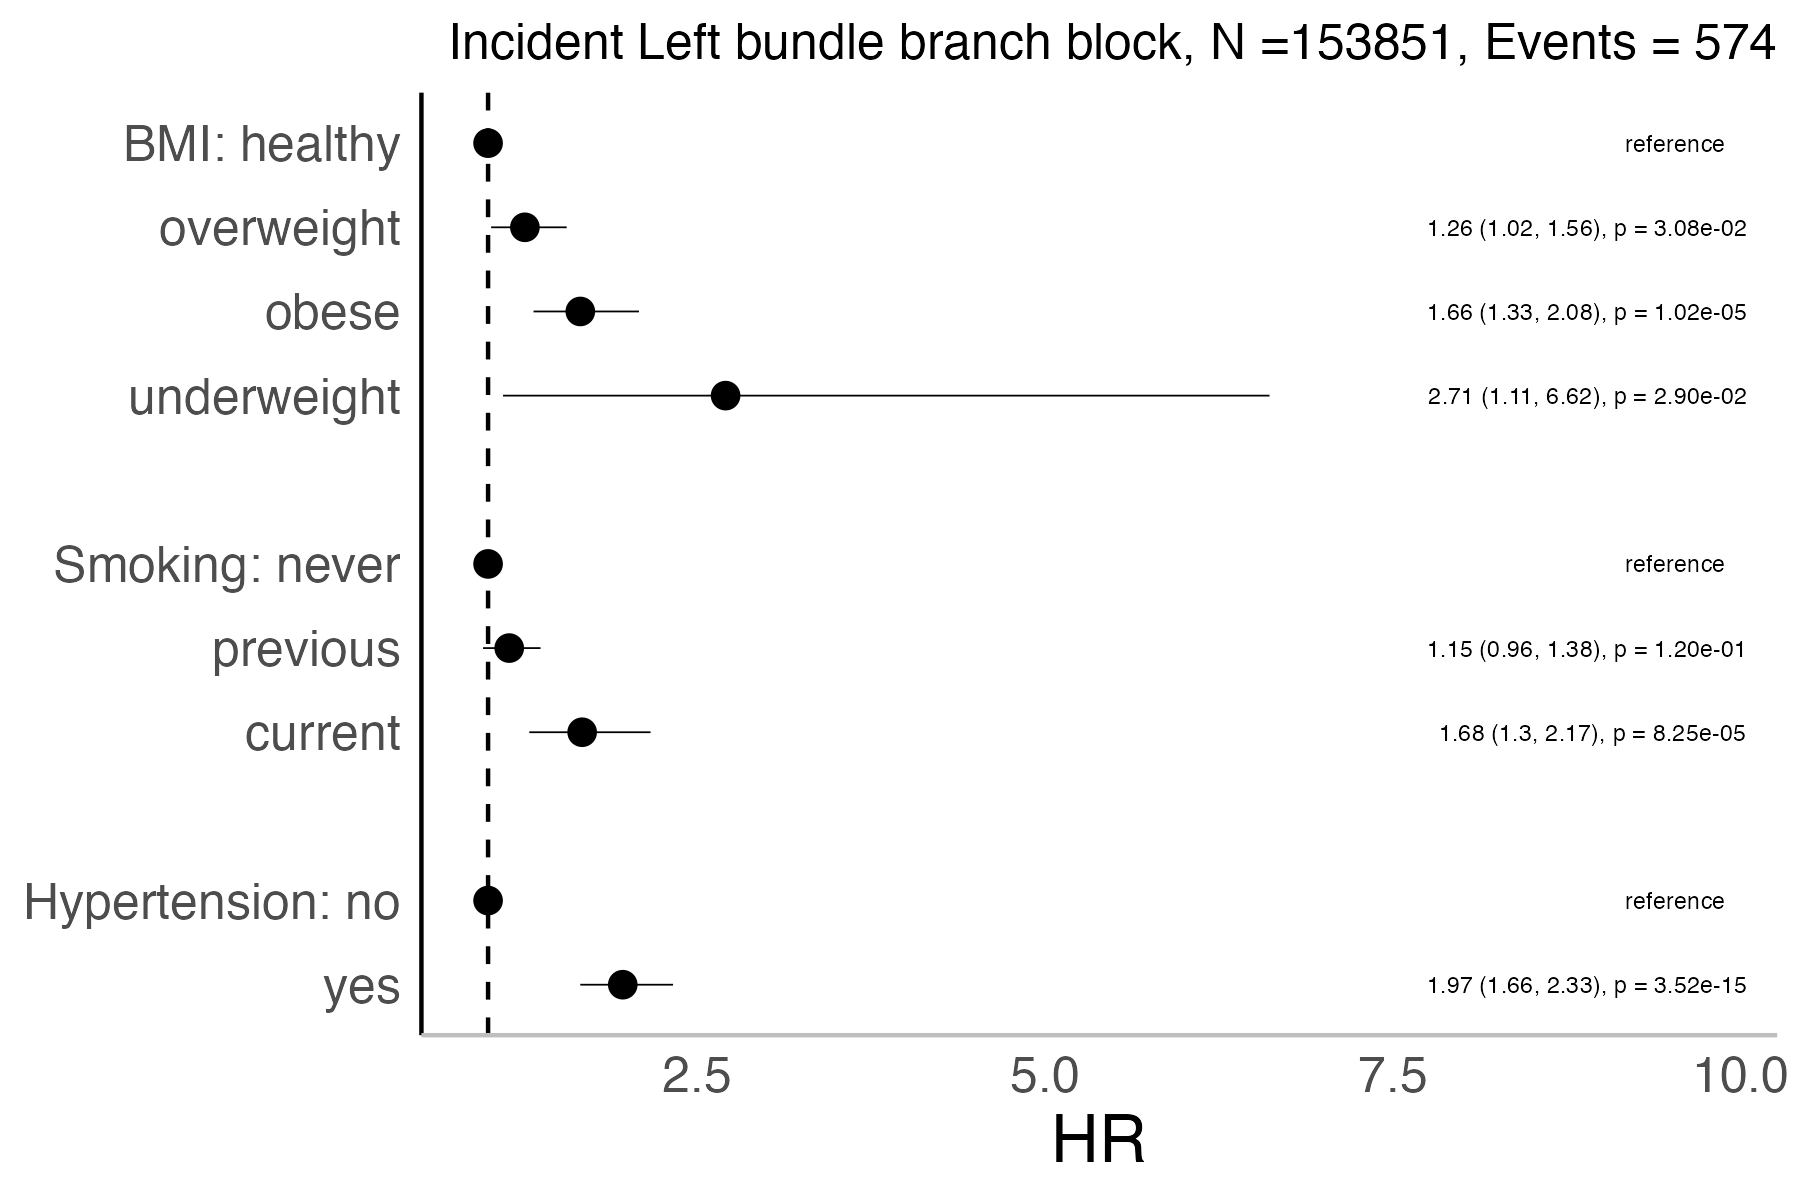
Risk factors analysis
‘Healthy’ BMI, smoking status ‘never’, or no hypertension (absence of hypertension records) were considered as reference values.
Hazard Ratio (HR) values with P < 0.0002 were considered to show significant association with disease onset after correction for multiple-testing using the Bonferroni method
N=154060, Events=218
| Factor |
Level |
Hazard Ratio |
P value |
| BMI |
overweight |
0.89 (0.65, 1.23) |
0.488 |
| BMI |
obese |
1.16 (0.82, 1.63) |
0.404 |
| BMI |
underweight |
0 (0, Inf) |
0.989 |
| smoking |
previous |
1.75 (1.31, 2.35) |
0.000182 |
| smoking |
current |
2.37 (1.58, 3.55) |
3.07e-05 |
| hypertension |
yes |
1 (0.74, 1.36) |
0.997 |
Definition
| UK Biobank field id |
Description |
Code |
Value |
| 41202 |
Diagnoses - main ICD10 |
I44.7 |
Left bundle-branch block, unspecified |
| 41204 |
Diagnoses - secondary ICD10 |
I44.7 |
Left bundle-branch block, unspecified |
| 40001 |
Underlying (primary) cause of death: ICD10 |
I44.7 |
Left bundle-branch block, unspecified |
| 40002 |
Contributory (secondary) causes of death: ICD10 |
I44.7 |
Left bundle-branch block, unspecified |
| 42040 |
GP clinical event records |
329A.00 |
ECG: left bundle branch block |
| 42040 |
GP clinical event records |
G562.11 |
Left bundle branch block |
| 42040 |
GP clinical event records |
G563.00 |
Left main stem bundle branch block |
| 42040 |
GP clinical event records |
XE0V3 |
Left bundle branch hemiblock |